
Ever wondered what your customers are really saying, even when they don't speak up? It’s like solving a puzzle where hard numbers blend with real stories from the field. In this post, we chat about mixing survey data (the numbers) with personal feedback (the voices) to build smarter strategies. Imagine noticing a spike in hesitations at checkout and then hearing directly from shoppers about why they pause. That's how savvy brands connect the dots, make better decisions, and boost their game plan. Ready to discover what your data has been hinting at?
Core Framework for Interpreting Consumer Insights Data

Consumer insights are little nuggets of information that help us understand what drives shoppers, what they need, and how they behave. We get these insights not just from hard numbers but also from personal stories. Imagine using a survey to see how many people pause at the checkout and then holding a focus group where participants share why they hesitate. One example might be: "Look, many shoppers pause because they have worries about pricing."
We uncover these stories with one-on-one interviews, focus groups, and even by observing people in their own environments (ethnography). And then there's social listening, which means checking public opinions on social media to capture feedback that pure numbers can miss. On the flip side, surveys, transaction data, and web or app metrics, like heatmaps showing where clicks happen, reveal clear patterns and trends.
The real power comes when you blend all these data types together. By combining market research, competitor insights, and industry reports with support from various teams, brands end up with a single source of truth for their decisions. For example, Netflix uses viewership data and signals of hesitation to shape its original content, while LEGO listens to sentiment trends to reconnect with its fans.
Tools like NielsenIQ, Infegy Atlas, and Sprinklr Insights bring together insights from more than 30 channels in real time, offering a complete view of the marketplace. With both feedback stories and solid numbers in hand, companies can refine their strategies and spark new product ideas. Every data point acts as a clue, and every narrative adds depth to the broader picture of consumer behavior.
Consumer Insights Data Collection and Preparation

Begin with structured surveys, social media mining, and web or app analytics like heatmaps and bounce rates to really understand consumer behavior. For instance, you might ask, "What feature made you click?" to capture those immediate reactions.
You gather data from many sources, purchase records, one-on-one interviews, and focus group sessions can all reveal the story behind the numbers. And sometimes, field observations catch those small details, like support responses and subtle behaviors that pure metrics might overlook.
It’s essential to clean up your raw data. That means merging transcripts and digital files, ditching duplicates, and updating records that might be outdated. Think of it as tidying up a messy room: getting rid of the old clutter and putting things in order brings clarity.
Using automated filtering tools such as Tableau, Power BI, and Qualtrics (tools that help visualize and manage your data) can ease the burden of data overload while keeping accuracy in check. These consumer insights tools streamline the whole process, freeing you up to focus on sharp analysis instead of wrestling with messy datasets.
In the end, reliable consumer insights come from thorough cleaning and careful preparation. When you review field observations and note down support responses with care, scattered information turns into clear, actionable intelligence. Regular updates and filtering keep your data fresh and perfectly tuned to the ever-changing consumer trends.
Analytical Techniques for Decoding Consumer Insights Data

Quantitative analysis gives us clear insights by spotting links in numbers. Picture tracing out trend graphs that map even the tiniest shifts in how folks interact with a website. For example, if you see a sudden surge in rage-clicks (repeated clicks out of frustration), that’s a red flag for an interface issue. By looking at these engagement numbers, you can easily tell what parts of a page draw attention and which ones push users away.
Qualitative coding is just as important. It’s all about grouping raw feedback into themes so the core opinions shine through. Imagine going through focus group notes and noticing a common remark like "I hesitate when I see the final price", that’s a hint of a deeper worry. Plus, sentiment analysis helps us see if the overall tone is positive, neutral, or negative. This mix of numbers and real stories gives us a much clearer view of what clients are really thinking.
Predictive intelligence, using tools like Azure ML or Google Cloud, takes things to the next level. These tools can forecast churn risks (the chance that customers will leave) and spot trends before they fully emerge. Take Netflix, they track hesitation metrics that hint at broader viewer concerns, which then guide their content moves. Similarly, LEGO uses early sentiment signals to adapt their product lines and stay in tune with customer needs.
Visualization techniques now help us turn these insights into clear, actionable formats. Dashboards with trend graphs, heatmaps that highlight interaction patterns, and overlays that break down demographics allow teams to see consumer behavior at a glance. When you tie these visualization tools with overall consumer insights, it supercharges your ability to read and act on data across multiple channels.
By blending numerical spikes with qualitative themes, these smart strategies reveal subtle shifts and emerging behaviors in your audience. Each method, whether it’s dissecting a sudden rise in click activity or sorting through recurring feedback themes, helps paint a clearer picture of how consumers think and act.
Consumer Insights Data: KPIs and Performance Metrics
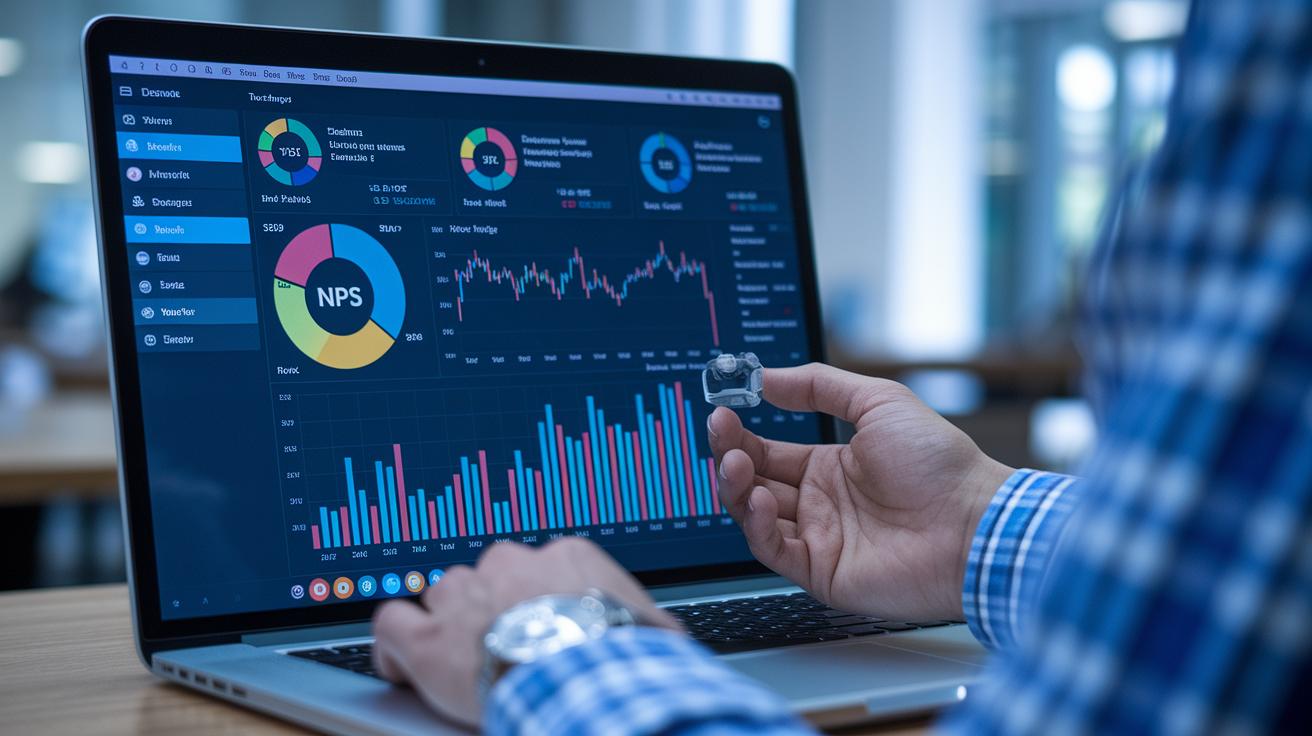
Understanding consumer insights isn’t just about raw numbers, it’s about telling the story behind customers’ actions. Think of metrics like the Net Promoter Score (which tells you how loyal customers are), rage-click rates (a sign of frustration), sentiment-score indices (helpful in gauging overall feedback tone), engagement rates, and predictive churn probabilities (estimates of customers likely to leave). Each one of these paints a picture of what’s working and what might need a quick fix, like when a sudden spike in rage clicks hints that something on a page might be off.
Tracking these shifts is a bit like reading the room at a buzz-filled party. By keeping an eye on trends in market sentiment and closely listening to customer feedback, you’re spotting early warning signs before they become big issues. These mood measures, gathered from everyday customer chatter, give marketers the freedom to adjust strategies on the fly. Whether you’re benchmarking overall feelings or comparing specific numerical trends, every little data point nudges you toward a better approach.
| Metric | Description | Common Tool |
|---|---|---|
| Net Promoter Score | Measures customer loyalty | Survey platforms |
| Rage-Click Rate | Indicates user frustration | Web analytics |
| Sentiment-Score Index | Tracks feedback tone | Sentiment analysis tools |
| Predictive Churn Probability | Estimates churn risk among customers | Predictive analytics platforms |
These key performance indicators give teams the tools to measure results accurately and predict shifts in consumer behavior, ensuring every strategy feels just right in the fast-paced world of digital marketing.
Case Studies: Applying Interpreting Consumer Insights Data to Drive Strategy

Netflix digs deep into its viewers' habits. They study every little action, even a brief pause right before a big scene. This tiny pause can show a growing interest and has helped boost engagement returns by 30%. Imagine a viewer hesitating at a trailer and then becoming curious, that small moment can steer major creative choices.
LEGO took a friendly, thoughtful route by looking at what people feel. They combed through customer comments and social buzz, spotting a mix of nostalgia and a hunger for modern twists. This hands-on review of feedback led them to launch a re-engagement plan that bumped up repeat purchases by 25%. Picture someone saying, "I love the classic sets but crave something more modern." That simple phrase helped LEGO pivot perfectly to match what customers really wanted.
Sprinklr Insights works like a real-time data hub, pulling info from over 30 channels. This lets teams catch the vibe of live online chatter and tweak their messaging right on the spot. Think of it like this: when there's a sudden burst of online buzz, teams quickly adjust their game plan. This flexible, smart approach, powered by tools that even predict trends (predictive analytics), has helped reduce customer churn by 15% in various sectors.
Each of these examples shows how brands blend hard numbers with real stories. By turning everyday signals into clear, strategic moves, they keep their marketing fresh and spot-on.
Final Words
In the action from start to finish, this article broke down the framework behind analyzing consumer insights. Short surveys, social media taps, and web analytics all play a part in cleaning up raw data for better clarity. Next, we explored smart techniques and real-life examples that show how trends and audience reactions can shape a brand’s strategy. Together, these ideas pave the way for confident, informed decision-making, leaving us inspired by the art of interpreting consumer insights data.
FAQ
FAQ
What does interpreting consumer insights data involve?
The process of interpreting consumer insights data means analyzing actionable information from surveys, social media, purchase patterns, and interviews. It reveals customer motivations, needs, and behaviors to shape effective strategies.
How do you prepare raw consumer data for analysis?
The steps for preparing raw consumer data include cleaning transcripts, removing duplicates, and updating records. Automated tools like Tableau and Power BI help filter noise and maintain the accuracy of the data.
What analytical techniques help decode consumer insights?
The techniques for decoding consumer insights involve qualitative coding, sentiment analysis, and predictive intelligence. They rely on dashboards with trend graphs, heatmaps, and demographic overlays to visually represent customer behavior.
Which key performance indicators matter in consumer insights analysis?
The key performance indicators include measures like Net Promoter Score, rage-click rates, sentiment scores, engagement metrics, and predictive churn probabilities. They help gauge customer reactions and market trends.
How have brands applied consumer insights data to drive strategy?
The application of consumer insights is seen when Netflix uses viewership patterns to plan content and LEGO leverages sentiment analysis for re-engagement strategies, resulting in improved engagement and repeat purchases.