
Ever wonder if your social media posts are really getting people talking? Look at the likes, comments, and shares, they're like a lively chat showing how folks feel about your content.
These numbers are more than just data. They're a pulse that tells you which posts hit the mark and which might need a little extra love. It’s the simple truth about what resonates with your audience.
And that insight? It’s your secret weapon. When you use these metrics, you can fine-tune your message to spark genuine connection and drive real growth.
Overview of Social Media Engagement Metrics
Social media engagement metrics are the numbers that show how your audience connects with your posts, think likes, comments, shares, retweets, and clicks. They help you see if your social strategy is really hitting the mark on platforms like Facebook, Instagram, Twitter, and LinkedIn.
These metrics give you a clear picture of which posts are capturing attention and sparking lively conversations. Picture a campaign where every like and share feels like a heartbeat, telling you just how alive your audience is. It’s more than just numbers, they reveal what your audience loves and point you toward your next big idea.
By keeping an eye on these figures, you can fine-tune your message, try out creative content, and adjust your posting times to reach more people. And there’s more: say hello to deeper insights, like tracking how long someone sticks around on a post or profile, a little detail that can mean the difference between a fleeting glance and a real connection.
In short, when you measure these digital responses and let them shape your strategy, you turn simple clicks into real growth and revenue.
social media engagement metrics drive winning results

Social media engagement metrics break down into two main types: the quick, visible actions that grab attention and the deeper, more intentional interactions that show lasting interest. It’s like comparing a casual nod to someone who simply says hello versus a friend who sticks around for a chat.
The basics, likes, comments, shares, saves, and even story taps, make up your immediate feedback. These numbers tell you right away if your audience is giving your content a quick thumbs-up or taking a moment to dig a bit deeper. For instance, a like is just a momentary cheer, while a comment might shout out, "This tip just changed my approach!"
Then there’s the video completion rate. When viewers watch a video from start to finish, it’s a good sign your message hit home. Imagine a product demo that holds attention all the way through because it really resonated, now that’s a win worth noting.
Consider the more personal signals too. Profile visits, the time someone spends on your page, and direct messages show real curiosity. Picture a moment when a spike in DMs leads someone to ask, "Where can I learn more?" That’s your content moving them from a casual glance to taking action.
Key metrics at a glance:
- Likes: A quick, positive nod.
- Comments: Spark conversations and show deeper interest.
- Shares: Expand your reach by getting your content in front of new eyes.
- Saves and story interactions: Indicate personal bookmarking and connection.
- Video completion rate: Proves your video content is engaging from start to finish.
- Profile visits and direct messages: Highlight a more committed and curious audience.
Measuring Engagement: Calculating Rates and Ratios

Let’s start with the engagement rate. Simply divide your total engagements by your total followers and multiply by 100. For example, if you have 200 engagements and 2,000 followers, you'll get a 10% engagement rate. This percentage gives you a quick sense of how much your audience is really interacting with your posts.
Next up is the click-through rate (CTR), which shows how often your audience clicks on your links. To calculate CTR, divide the number of clicks by the total impressions (the number of times your content is viewed) and multiply by 100. Picture this: you post a product update that gets 1,000 views and 50 clicks. That gives you a CTR of 5%. This number tells you if your call-to-action and links are truly engaging.
Now, consider your conversion rate, which measures how well your clicks turn into actions like sign-ups or purchases. Simply take the number of conversions, divide it by your total clicks, and multiply by 100. Imagine a campaign where 200 clicks lead to 10 sales, that’s a conversion rate of 5%. This insight helps you understand how effective your campaign is at driving results.
| Step | Key Action |
|---|---|
| Engagement Rate | Total Engagements ÷ Total Followers × 100 |
| CTR | Clicks ÷ Impressions × 100 |
| Conversion Rate | Conversions ÷ Total Clicks × 100 |
By running these simple calculations, you get a well-rounded view of your campaign’s performance. It’s like taking a snapshot of the energy around your digital efforts, helping you tweak your strategy for even better results.
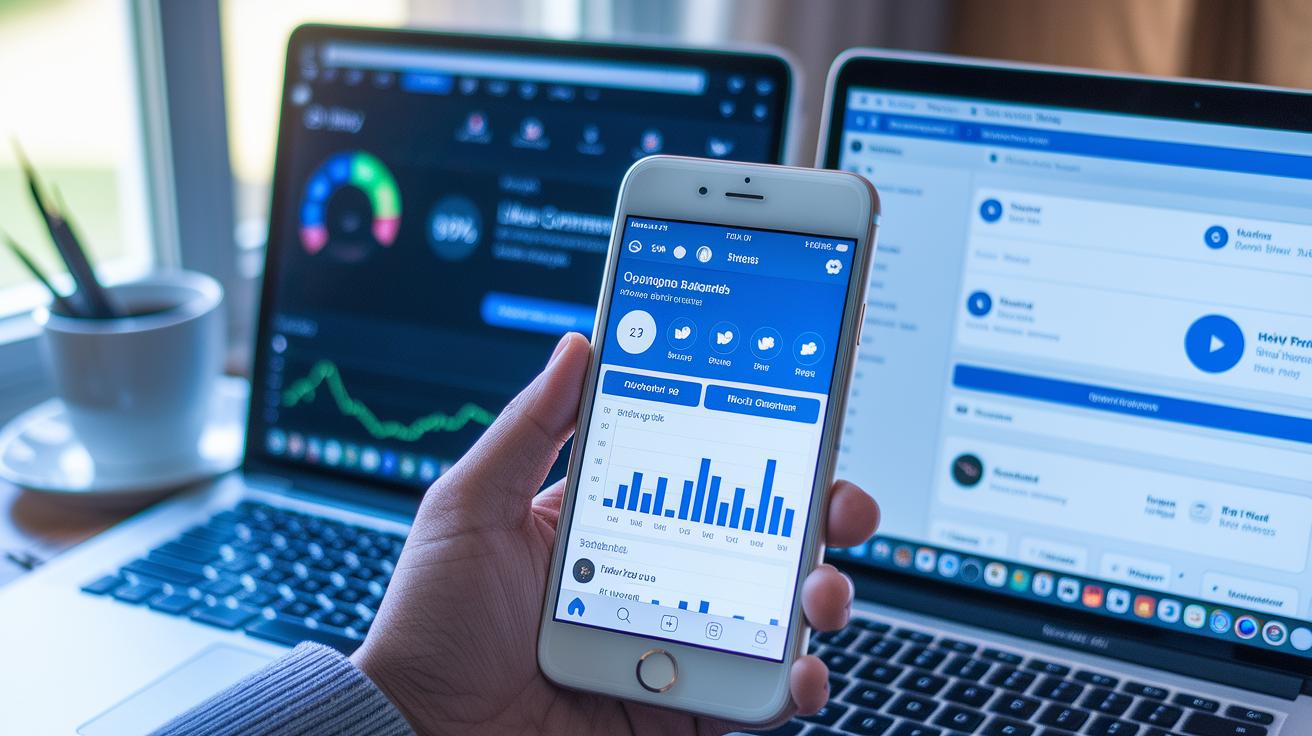
Top Tools for Tracking Social Media Engagement Metrics

When it comes to measuring your social media buzz, having the right tool is like chatting over coffee with a savvy friend who breaks down complicated numbers into clear, actionable insights. Google Analytics truly shines here. It's excellent for referral tracking (which means it follows every click from your social posts to your website). Imagine glancing at your referral dashboard and instantly knowing which post is driving the most traffic – it’s like having a secret weapon that saves you time and dodges endless manual work.
Then you have Sprout Social and Hootsuite. These tools pull all your data into one easy-to-use dashboard, so you can see likes, comments, shares, and more, all in one spot. They even come with AI-powered social listening (basically smart tech that picks up on trending conversations) and customizable reporting that lets you tweak your content strategy on the fly. Think of them as your digital command center, keeping you in tune with what your audience is doing in real time.
Native analytics tools add even more depth. Platforms like Meta Business Suite, TikTok Analytics, X Analytics, and LinkedIn Analytics offer a microscopic view of what really clicks with each community on their own turf. They help you fine-tune your approach by showing exactly which content works best on each platform.
Here’s a quick look at the main perks:
| Benefit | Description |
|---|---|
| Centralized Dashboards | All your social data in one view, making it easy to track overall performance. |
| AI-Powered Features | Smart tools that cut through the noise and highlight what truly matters. |
| Customizable Reports | Reports that adapt to your strategy, ensuring you always have the insights you need. |
Together, these tools form a robust toolkit that connects every dot between your social activity and campaign performance. It's all about staying responsive and keeping your strategy both sharp and effective.
Interpreting Engagement Data and Setting Benchmarks

If you want to truly understand your audience, checking your engagement numbers often is essential. With simple stats like reach (how many people see your content), impressions (the number of times your post shows up) and user actions (likes, comments, shares), you get a clear picture of which posts spark conversation and which ones drift by, much like checking your pulse during a workout.
Tools like dashboards and spreadsheets can be super handy here. They help you see trends over time. For example, if your impressions spike on days when you share interactive content, that's a strong clue for your content calendar. Use your past results and industry standards, like comparing your average engagement rate with similar brands, to set solid benchmarks for success.
Here are some easy steps to make sense of your data:
- Track your past performance to notice growth patterns.
- Look at trend reports to spot seasonal or campaign-related changes.
- Compare your numbers with those of similar brands.
- Set specific goals, such as boosting profile visits by a set percentage.
For instance, if you consistently see a 10% engagement rate on posts that ask questions, it’s a clear sign that your audience loves interactive content. Use that insight as a benchmark and plan similar posts to keep your strategy fresh and closely aligned with what your followers enjoy.
Platform-Specific Engagement Metrics Explained

Each social media network has its own way of showing how people interact with your posts. Think of it like different recipes for your favorite coffee, each platform adds its special flavor that hints at its unique audience vibe.
On Facebook, you figure out your post’s strength by checking likes, shares, comments, and overall reach. Imagine a post that gets hundreds of shares; that signals that it really struck a chord with the audience and is ready to spread even further.
Instagram mixes things up a bit. It’s not just about likes and comments; you also keep an eye on how many times a post gets saved or how many story replies it pulls in. For instance, if a photo gets a high number of saves, it tells you that your followers found it useful enough to keep for later. And when every story reply turns into a mini-conversation, you know you’ve built a personal connection.
Then there’s Twitter, where the pace is fast and lively. Here, likes, retweets, mentions, and replies are the main players. A tweet that accumulates many retweets can quickly become the talk of the town, boosting both brand awareness and buzz. Ever seen how one mention can spark a wave of interaction? It’s like watching a spark ignite a fire.
On LinkedIn, things have a professional twist. Metrics like engagement rate, clicks, and shares tell you if your industry insights are capturing attention and inspiring action. Picture a post about market trends that gets clicked on by many, leading to deeper company research, that’s professional engagement in action.
Pinterest, known for its visual appeal, measures success through repins and clicks. An image that gets repinned over and over again shows it really resonates with viewers and might serve as inspiration for them later.
YouTube focuses on the story told through videos. Key metrics like overall watch time, likes, and comments help you see if viewers are fully engaging with your content. For example, a how-to video that keeps audiences watching until the end shows that your content is both informative and captivating.
By understanding these platform-specific details, marketers can tailor their strategies to match the unique flow of each social network and better connect with their audience.
Optimizing Engagement: Best Practices to Increase Metrics

Using striking visuals and dynamic videos can really supercharge your social media numbers. Clear, engaging photos and snappy video clips grab attention much faster than plain old text. Think of a quick behind-the-scenes clip that shows off your creative process in less than 30 seconds, fast, real, and unforgettable.
Keeping a regular posting schedule is another key move. It builds trust with your audience, like tuning in to your favorite TV show, you know exactly when to catch the next episode. Your followers learn when to expect fresh content, which naturally ramps up the interaction.
Here are some practical tips:
- Use smart hashtag strategies: Choose hashtags that match your content and your audience’s interests. This simple trick broadens your reach and connects you with people who are into what you do.
- Bring in interactive elements: Tools like polls, quizzes, and live Q&A sessions can turn onlookers into active partakers. Imagine tossing out a quick poll asking, “What content do you want next?”, it instantly pulls your audience in and gives you valuable feedback.
- Respond to your brand mentions quickly: Reply to comments and messages like you’re chatting one-on-one. This personal touch makes people feel noticed and appreciated.
- Split your audience into groups: Tailor content for different segments based on what they like or how they act. For example, one post could speak to tech buffs while another hits home with creative minds, so every message hits its mark.
- Add clear calls to action: Guide your audience with easy steps such as “Comment with your thoughts” or “Share if you agree.” These simple prompts steer engagement and help you see who’s interacting.
When you mix top-notch content with smart community care and clear calls to action, your engagement stats aren’t just numbers, they become a living sign of your digital impact.
Future Trends in Social Media Engagement Metrics

Social media engagement is stepping into a new era. Marketers are moving away from simple numbers and instead focusing on quality interactions. Think about it: a direct message or a profile visit can mean much more than a like ever did. Imagine watching your dashboard update the moment someone sends a DM after seeing your post, it’s a clear sign your content is truly connecting.
New tech is adding some serious sparkle to the scene. Augmented reality (AR) and virtual reality (VR) experiences are starting to change the way we interact online. Picture an AR filter that not only delights users but also tracks how many people play with it. This fresh data gives you a whole new perspective on what your audience really finds exciting.
Then there’s the role of AI (artificial intelligence). Marketers now use AI-powered tools to perform sentiment analysis instantly, analyzing real-time feedback like a friendly chat that tells you exactly how people feel about your content. This quick insight helps you foresee any shifts in engagement before they become trends.
Real-time tracking empowers brands to adapt their strategies on the fly. Imagine a campaign that tweaks itself based on live data, turning personal interactions into winning results. By focusing on meaningful engagement, marketers can make every post count and truly resonate with their audience.
Final Words
In the action, we explored how social media engagement metrics serve as vital data points that measure audience interest, from likes and shares to video completions. We broke down key metrics, calculated rates, and reviewed trusty tools for tracking these numbers. Plus, we discussed practical ways to ramp up performance and set meaningful benchmarks. Each section stitched together actionable insights that simplify complex concepts, making it easier to spot trends and make smart decisions. Stay positive and keep refining your strategy as you track social media engagement metrics for better results.
FAQ
What are social media engagement metrics examples?
Social media engagement metrics examples include likes, comments, shares, saves, retweets, and video views. They indicate how users interact with your content and help refine your content strategy.
How does a social media metrics tracker work?
A social media metrics tracker gathers your engagement data in one place using dashboards from tools like Hootsuite or Sprout Social. It simplifies monitoring and highlights trends over time.
Where can I find free social media engagement metrics, tracker resources, or PDF templates?
Free tracking resources come from native platform analytics and downloadable templates online. They offer an easy, cost-effective way to monitor your engagement data using simple, ready-to-use formats.
What social media metrics help measure brand awareness?
Social media metrics for brand awareness focus on reach, impressions, and mentions. They show how many people view your content and help tailor your strategy for better visibility.
What engagement metrics are key for Instagram?
Social media metrics on Instagram concentrate on likes, comments, saves, story interactions, and profile visits. These numbers reveal how well your content resonates with your audience.
What does the 70/20/10 rule mean for social media?
The 70/20/10 rule signifies a mix of 70% original content, 20% curated posts, and 10% self-promotion, maintaining a balanced content mix that keeps followers interested.
What is the 30 30 30 rule for social media?
The 30 30 30 rule divides your strategy evenly between content production, audience engagement, and promotion. This balanced approach helps consistently drive interaction and growth.
What is the 5 3 2 rule for social media?
The 5 3 2 rule suggests sharing five curated posts, three original posts, and two personal posts within a set period. This mix fosters variety while keeping your audience engaged.
What does the 5 5 5 rule for social media entail?
The 5 5 5 rule recommends posting five regular updates, five stories, and five separate engagement activities each week to maintain a steady rhythm across your platforms.
What tools can I use to track social media metrics?
Social media metrics tools range from native analytics on platforms like Instagram and Facebook to third-party software such as Sprout Social and Google Analytics. They track engagement, clicks, reach, and performance trends.
What is a social media performance report?
A social media performance report compiles key engagement insights like likes, comments, shares, and click-through rates. It offers data-backed recommendations to sharpen your social strategy.
What are the forecasted social media metrics for 2025?
Social media metrics in 2025 are expected to give more weight to direct messages and profile visits, alongside traditional metrics. They will incorporate AI-driven insights for real-time campaign adjustments.
How can a social media metrics template help me?
A social media metrics template organizes your key data points like likes, comments, reach, and impressions. It makes tracking trends straightforward while guiding future content strategies.
What do social media insights reveal?
Social media insights capture user behavior and engagement patterns. They provide a clear picture of how your audience interacts with content and offer practical guidance for refining your strategy.

